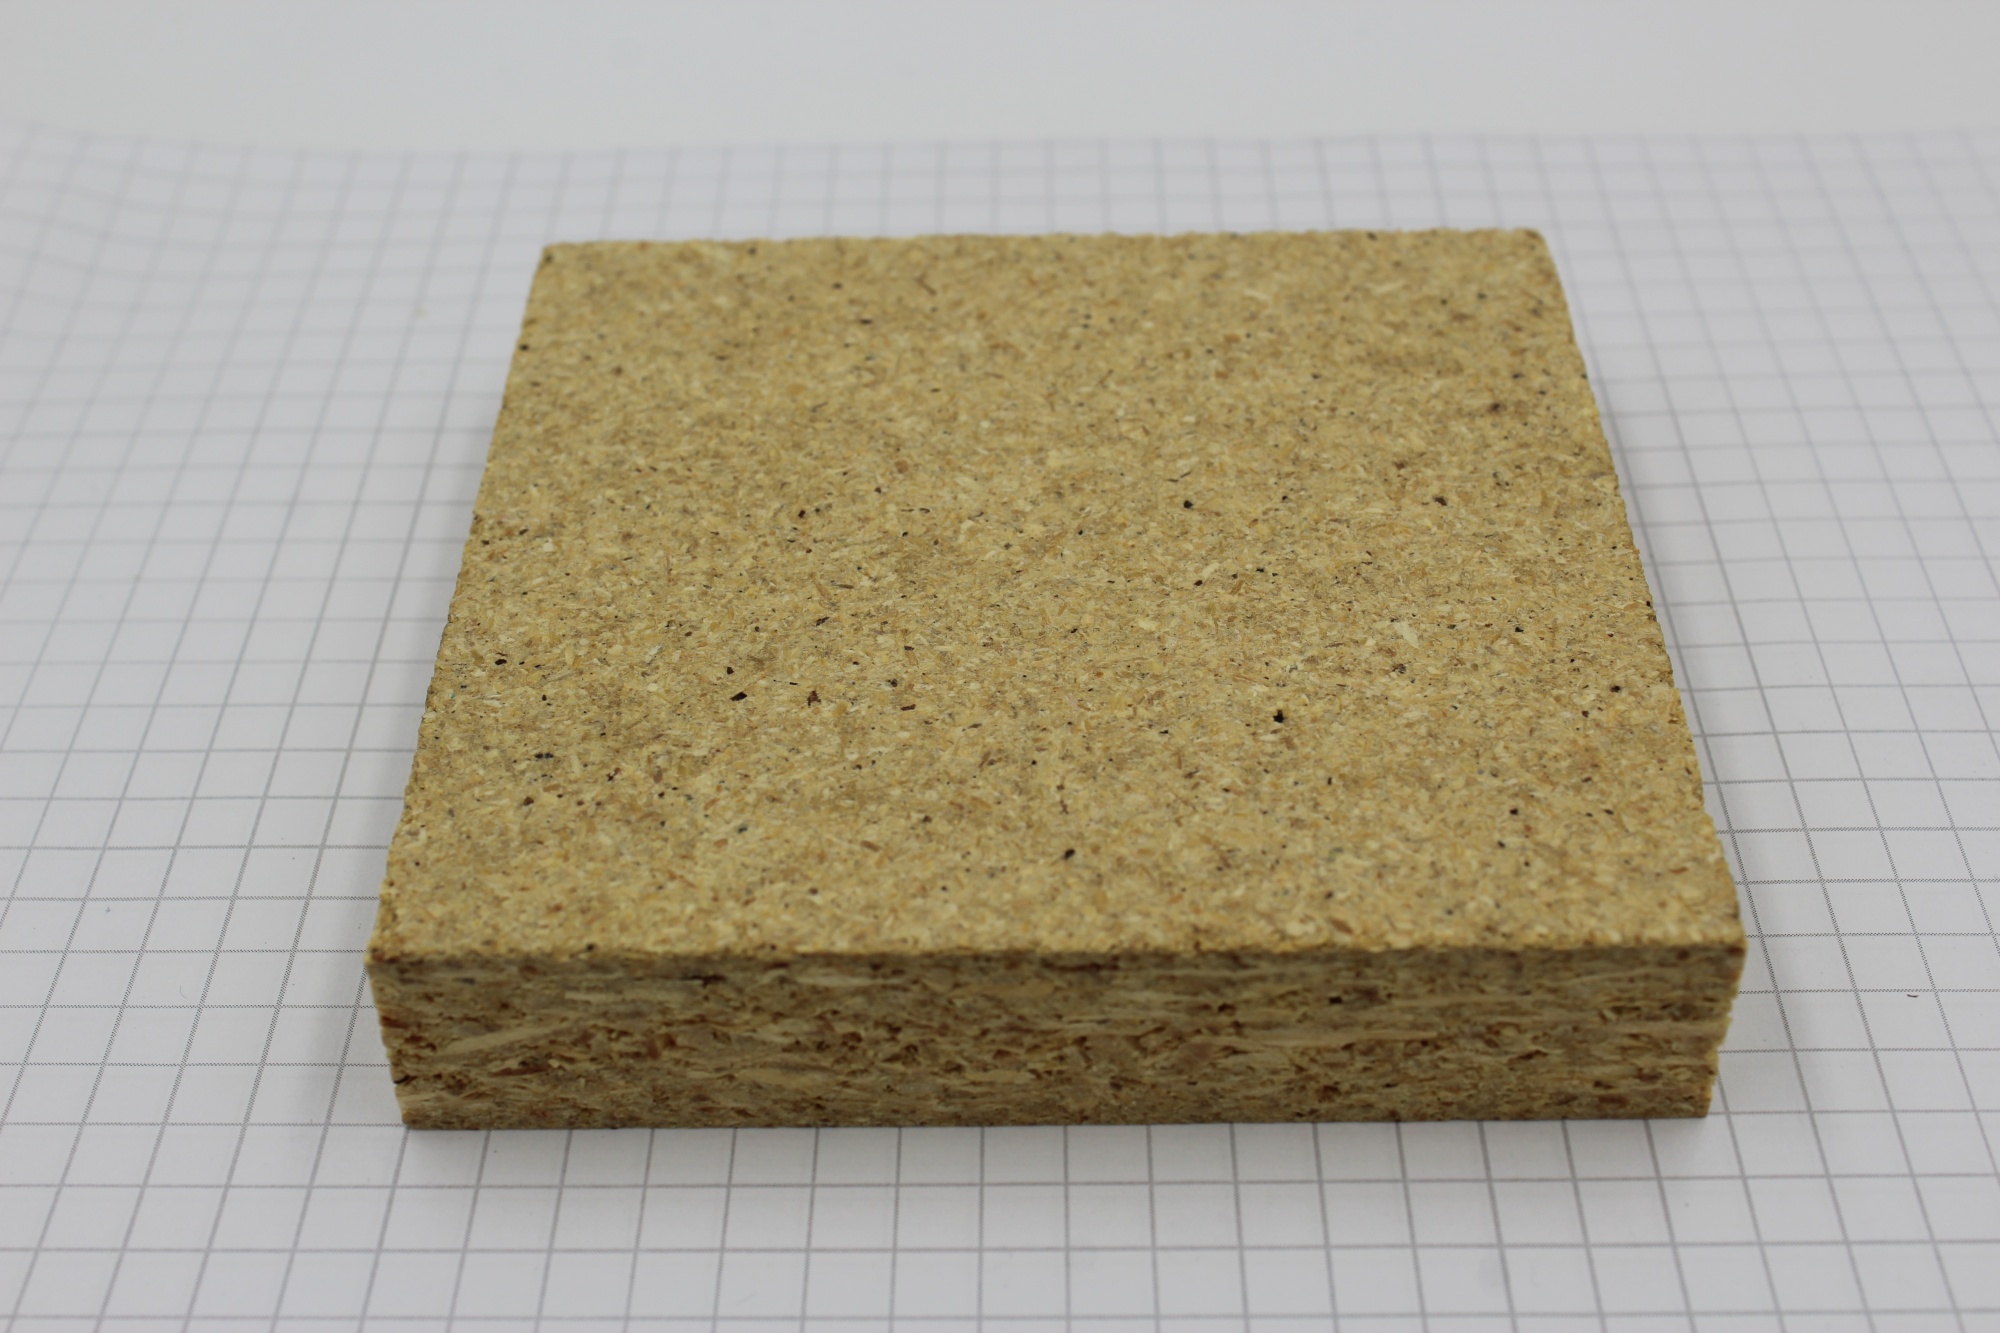
Measured Data
Specific Heat
Experiments for specific heat [J/(kg K)], or heat capacity, were conducted using a heat flow meter on unconditioned and dried samples at 10 °C, 20 °C, 30 °C and 40 °C.
Unconditioned
| Temperature (C) | Specific Heat Mean (J/kg-K) | Standard Deviation (J/kg-K) |
|---|---|---|
| 10.0 | 1368.0 | 25.0 |
| 20.0 | 1437.0 | 32.0 |
| 30.0 | 1507.0 | 26.0 |
| 40.0 | 1578.0 | 33.0 |
Dried
| Temperature (C) | Specific Heat Mean (J/kg-K) | Standard Deviation (J/kg-K) |
|---|---|---|
| 10.0 | 1205.0 | 24.0 |
| 20.0 | 1253.0 | 18.0 |
| 30.0 | 1299.0 | 20.0 |
| 40.0 | 1354.0 | 38.0 |
Thermal Conductivity
Experiments for thermal conductivity [W/(m K)] were conducted using a heat flow meter on unconditioned and dried samples at 15 °C and either 45 °C or 65 °C.
Unconditioned
| Temperature (C) | Conductivity Mean (W/m-K) | Standard Deviation (W/m-K) |
|---|---|---|
| 15.0 | 0.124 | 0.003 |
| 45.0 | 0.134 | 0.003 |
Dried
| Temperature (C) | Conductivity Mean (W/m-K) | Standard Deviation (W/m-K) |
|---|---|---|
| 15.0 | 0.111 | 0.001 |
| 45.0 | 0.117 | 0.001 |
Mass Loss Rate (MLR)
Initial-mass-normalized mass loss rate [1/s] was measured in the simultaneous thermal analyzer experiments at three heating rates: 3 K/min, 10 K/min, and 30 K/min and mass loss rate [g/s] in the cone calorimeter at three heat fluxes: 25 kW/m2, 50 kW/m2, and 75 kW/m2.
Cone Calorimeter Test Notes:
This material warps and shrinks during cone calorimeter tests. Warping was observed in the first test (HF25_R1) and prevented in all subsequent tests by the use of tie wires. The sample self-extinguished in one test, HF25_R3, and reignited after the spark ignitor was inserted. Representative test pictures are available at the link above to Download raw data.
Simultaneous Thermal Analyzer
Cone Calorimeter: 25 kW/m2
Cone Calorimeter: 50 kW/m2
Cone Calorimeter: 75 kW/m2
Heat Release Rate Per Unit Area (HRRPUA)
Experiments for heat release per unit area [kW/m2] were conducted on samples conditioned at 20°C and 50% relative humidity using a cone calorimeter at three different heat fluxes: 25 kW/m2, 50 kW/m2, and 75 kW/m2.
This material warps and shrinks during cone calorimeter tests. Warping was observed in the first test (HF25_R1) and prevented in all subsequent tests by the use of tie wires. The sample self-extinguished in one test, HF25_R3, and reignited after the spark ignitor was inserted. Representative test pictures are available at the link above to Download raw data.
Cone Calorimeter: 25 kW/m2
Cone Calorimeter: 50 kW/m2
Cone Calorimeter: 75 kW/m2
Carbon Monoxide (CO) Yield
Carbon monoxide yield was measured during cone calorimeter experiments conducted at heat fluxes of 25 kW/m2, 50 kW/m2, and 75 kW/m2.
This material warps and shrinks during cone calorimeter tests. Warping was observed in the first test (HF25_R1) and prevented in all subsequent tests by the use of tie wires. The sample self-extinguished in one test, HF25_R3, and reignited after the spark ignitor was inserted. Representative test pictures are available at the link above to Download raw data.
| Incident Heat Flux [kW/m²] | Mean CO Yield [g/g] | CO Yield Std. Dev. [g/g] |
|---|---|---|
| 25 | 0.027 | 0.003 |
| 50 | 0.006 | 0.0 |
| 75 | 0.006 | 0.0 |
Specific Heat Release Rate
Experiments for specific heat release rate [W/g], were conducted using a micro-scale combustion calorimeter at a heating rate of 30 K/min.
Derived Data
Effective Heat of Combustion (Δhc)
Effective heat of combustion [MJ/kg] is calculated from data collected in both micro-scale combustion calorimeter experiments and cone calorimeter experiments.
Cone Calorimeter Test Notes:
This material warps and shrinks during cone calorimeter tests. Warping was observed in the first test (HF25_R1) and prevented in all subsequent tests by the use of tie wires. The sample self-extinguished in one test, HF25_R3, and reignited after the spark ignitor was inserted. Representative test pictures are available at the link above to Download raw data.
Micro-scale Combustion Calorimeter
| Value | R1 | R3 | R4 | Mean | Std. Dev. |
|---|---|---|---|---|---|
| Heat of Combustion (MJ/kg) | 12.6 | 11.54 | 11.19 | 11.78 | 0.6 |
Cone Calorimeter
| Incident Heat Flux [kW/m²] | Mean Effective Heat of Combustion [MJ/kg] | Effective Heat of Combustion Std. Dev. [MJ/kg] |
|---|---|---|
| 25 | 12.1 | 0.3 |
| 50 | 13.5 | 0.0 |
| 75 | 14.5 | 0.1 |
Band Averaged Emissivity
Band averaged emissivity was calculated from reflectance measurements conducted with an integrating sphere and Fourier transform infrared spectrometer.
| Source Temperature [K] | Emissivity | Std. Dev. |
|---|---|---|
| 600.0 | 0.929 | 0.001 |
| 800.0 | 0.902 | 0.002 |
| 1000.0 | 0.866 | 0.004 |
| 1200.0 | 0.827 | 0.007 |
| 1400.0 | 0.791 | 0.010 |
| 1600.0 | 0.759 | 0.013 |
| 1800.0 | 0.732 | 0.015 |
| 2000.0 | 0.710 | 0.018 |
